
Process Flow Diagram (PFD) for Mechanical Engineers
- Bk Engineering
- Mar 19
- 4 min read
Updated: 1 day ago

TABLE OF CONTENTS
Introduction
A Process Flow Diagram (PFD) is a crucial tool in engineering, particularly in mechanical and chemical engineering disciplines. It provides a high-level visual representation of a process, showcasing the flow of materials, energy, and major equipment involved in an industrial system. The PFD is primarily used for designing, analyzing, and optimizing processes in industries such as oil and gas, chemical manufacturing, power plants, and water treatment facilities.

Purpose of a Process Flow Diagram
The main objectives of a PFD are:
To visualize the overall process – It provides a clear understanding of how different components interact in a system.
To serve as a basis for design – Engineers use PFDs to develop detailed designs, equipment layouts, and piping diagrams.
To facilitate communication – It helps engineers, operators, and stakeholders understand the process and identify potential inefficiencies.
To assist in process optimization – By analyzing a PFD, engineers can suggest improvements to enhance efficiency and reduce costs.
Components of a Process Flow Diagram
A typical PFD consists of the following elements:
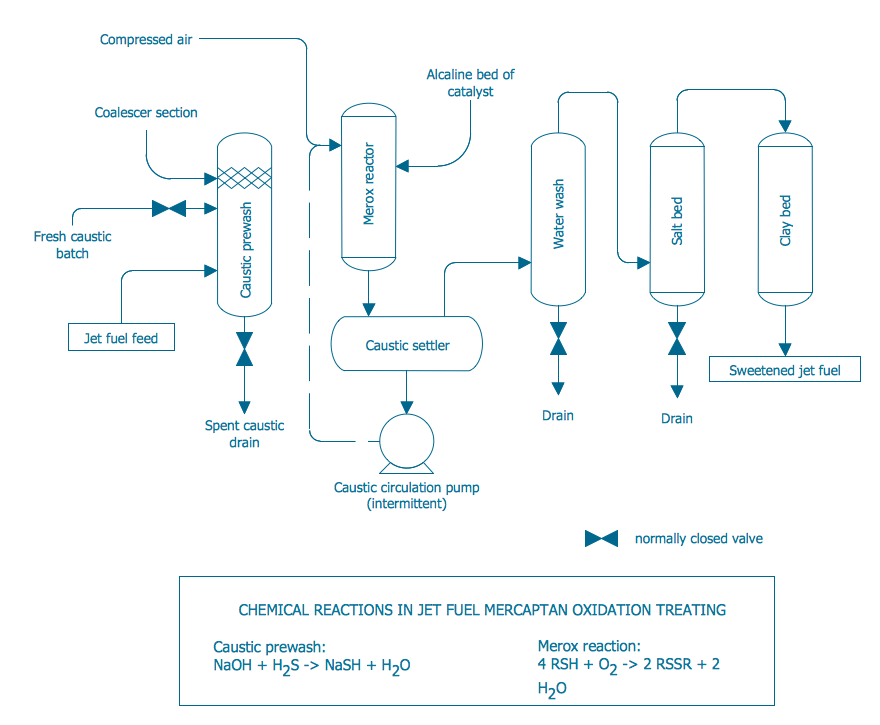
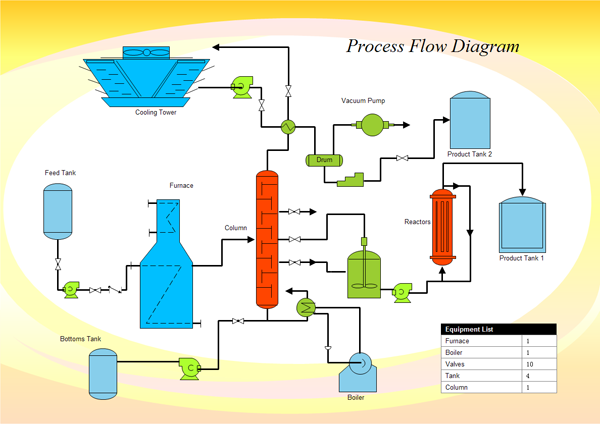
Major Equipment
Represented by symbols, major equipment includes pumps, compressors, heat exchangers, reactors, distillation columns, and other process units.
Each piece of equipment is labeled with a unique identifier.
Process Flow Lines
These lines indicate the movement of fluids, gases, and solids between different process units.
Arrows on the lines define the direction of flow.
Process Parameters
Essential parameters such as pressure, temperature, and flow rate are annotated on the PFD to provide operational details.
Control Valves and Instrumentation
Control loops, sensors, and valves are marked to show how the process is monitored and regulated.
Utilities and Auxiliary Systems
These include steam, cooling water, compressed air, and fuel systems, which support the primary process.
Differences Between PFD and P&ID

It is important to differentiate a Process Flow Diagram (PFD) from a Piping and Instrumentation Diagram (P&ID):
Feature | PFD | P&ID |
Level of Detail | High-level overview | Detailed representation |
Includes Piping? | Only major flow lines | All piping connections |
Includes Instruments? | Basic instrumentation | All instrumentation and control details |
Purpose | Conceptual understanding | Engineering and operational reference |

Standard Symbols in PFDs

To maintain uniformity, standardized symbols are used in PFDs. Some commonly used standards include:
ISO 10628 – Flow diagrams for process plants.
ANSI/ISA-5.1 – Instrumentation symbols and identification.
API RP 14C – Offshore production safety systems.
Common equipment symbols include:
Pump: Circle with an arrow inside.
Heat Exchanger: Two parallel lines with cross-hatching.
Reactor: Large rectangle or vessel shape.
Compressor: Circle with a triangle inside.
Understanding symbols and notation
Each symbol in a PFD is standardized and represents a specific part of the process:
Ovals or Ellipses usually represent the start or end of a process.
Rectangles or Boxes indicate a process step or an action in the sequence.
Diamonds are generally used for decision points where the process might branch based on a yes/no question or other criteria.
Arrows show the flow direction, linking different steps and indicating the sequence of operations.
Parallelograms often depict inputs (like raw materials or data) entering the process or outputs (like finished products or reports) resulting from the process.
Familiarity with these symbols is the first step in understanding a PFD. Different industries might adopt specific variations or additional symbols, so it's important to create a legend or key on your diagram for reference.
How to Create a Process Flow Diagram
Creating a PFD involves several systematic steps:
Identify the process scope:
Define the boundaries of the system.
List all inputs and outputs.
List major equipment and process steps:
Arrange them logically based on the sequence of operations.
Draw process flow lines:
Connect the equipment using standardized symbols.
Indicate material flow directions.
Add operating parameters:
Include critical temperature, pressure, and flow rate data.
Review and validate the diagram:
Cross-check with process engineers and operators.
Ensure compliance with industrial standards.
Applications of PFDs in Mechanical Engineering
Power Generation: Steam and gas turbine processes.
Chemical Processing: Refining, petrochemicals, and fertilizer production.
Water Treatment: Desalination and wastewater processing.
Food and Beverage Industry: Breweries, dairy plants, and sugar mills.
Pharmaceuticals: Drug formulation and batch processing.
Conclusion
A Process Flow Diagram (PFD) is a fundamental engineering document that aids in understanding and designing complex industrial processes. By clearly illustrating the flow of materials and major equipment, PFDs enable engineers to optimize operations, enhance efficiency, and ensure safety. Mastering the creation and interpretation of PFDs is essential for any mechanical engineer involved in process industries.
By following industry standards and best practices, engineers can effectively utilize PFDs as a powerful tool in system design and analysis.
Comments